
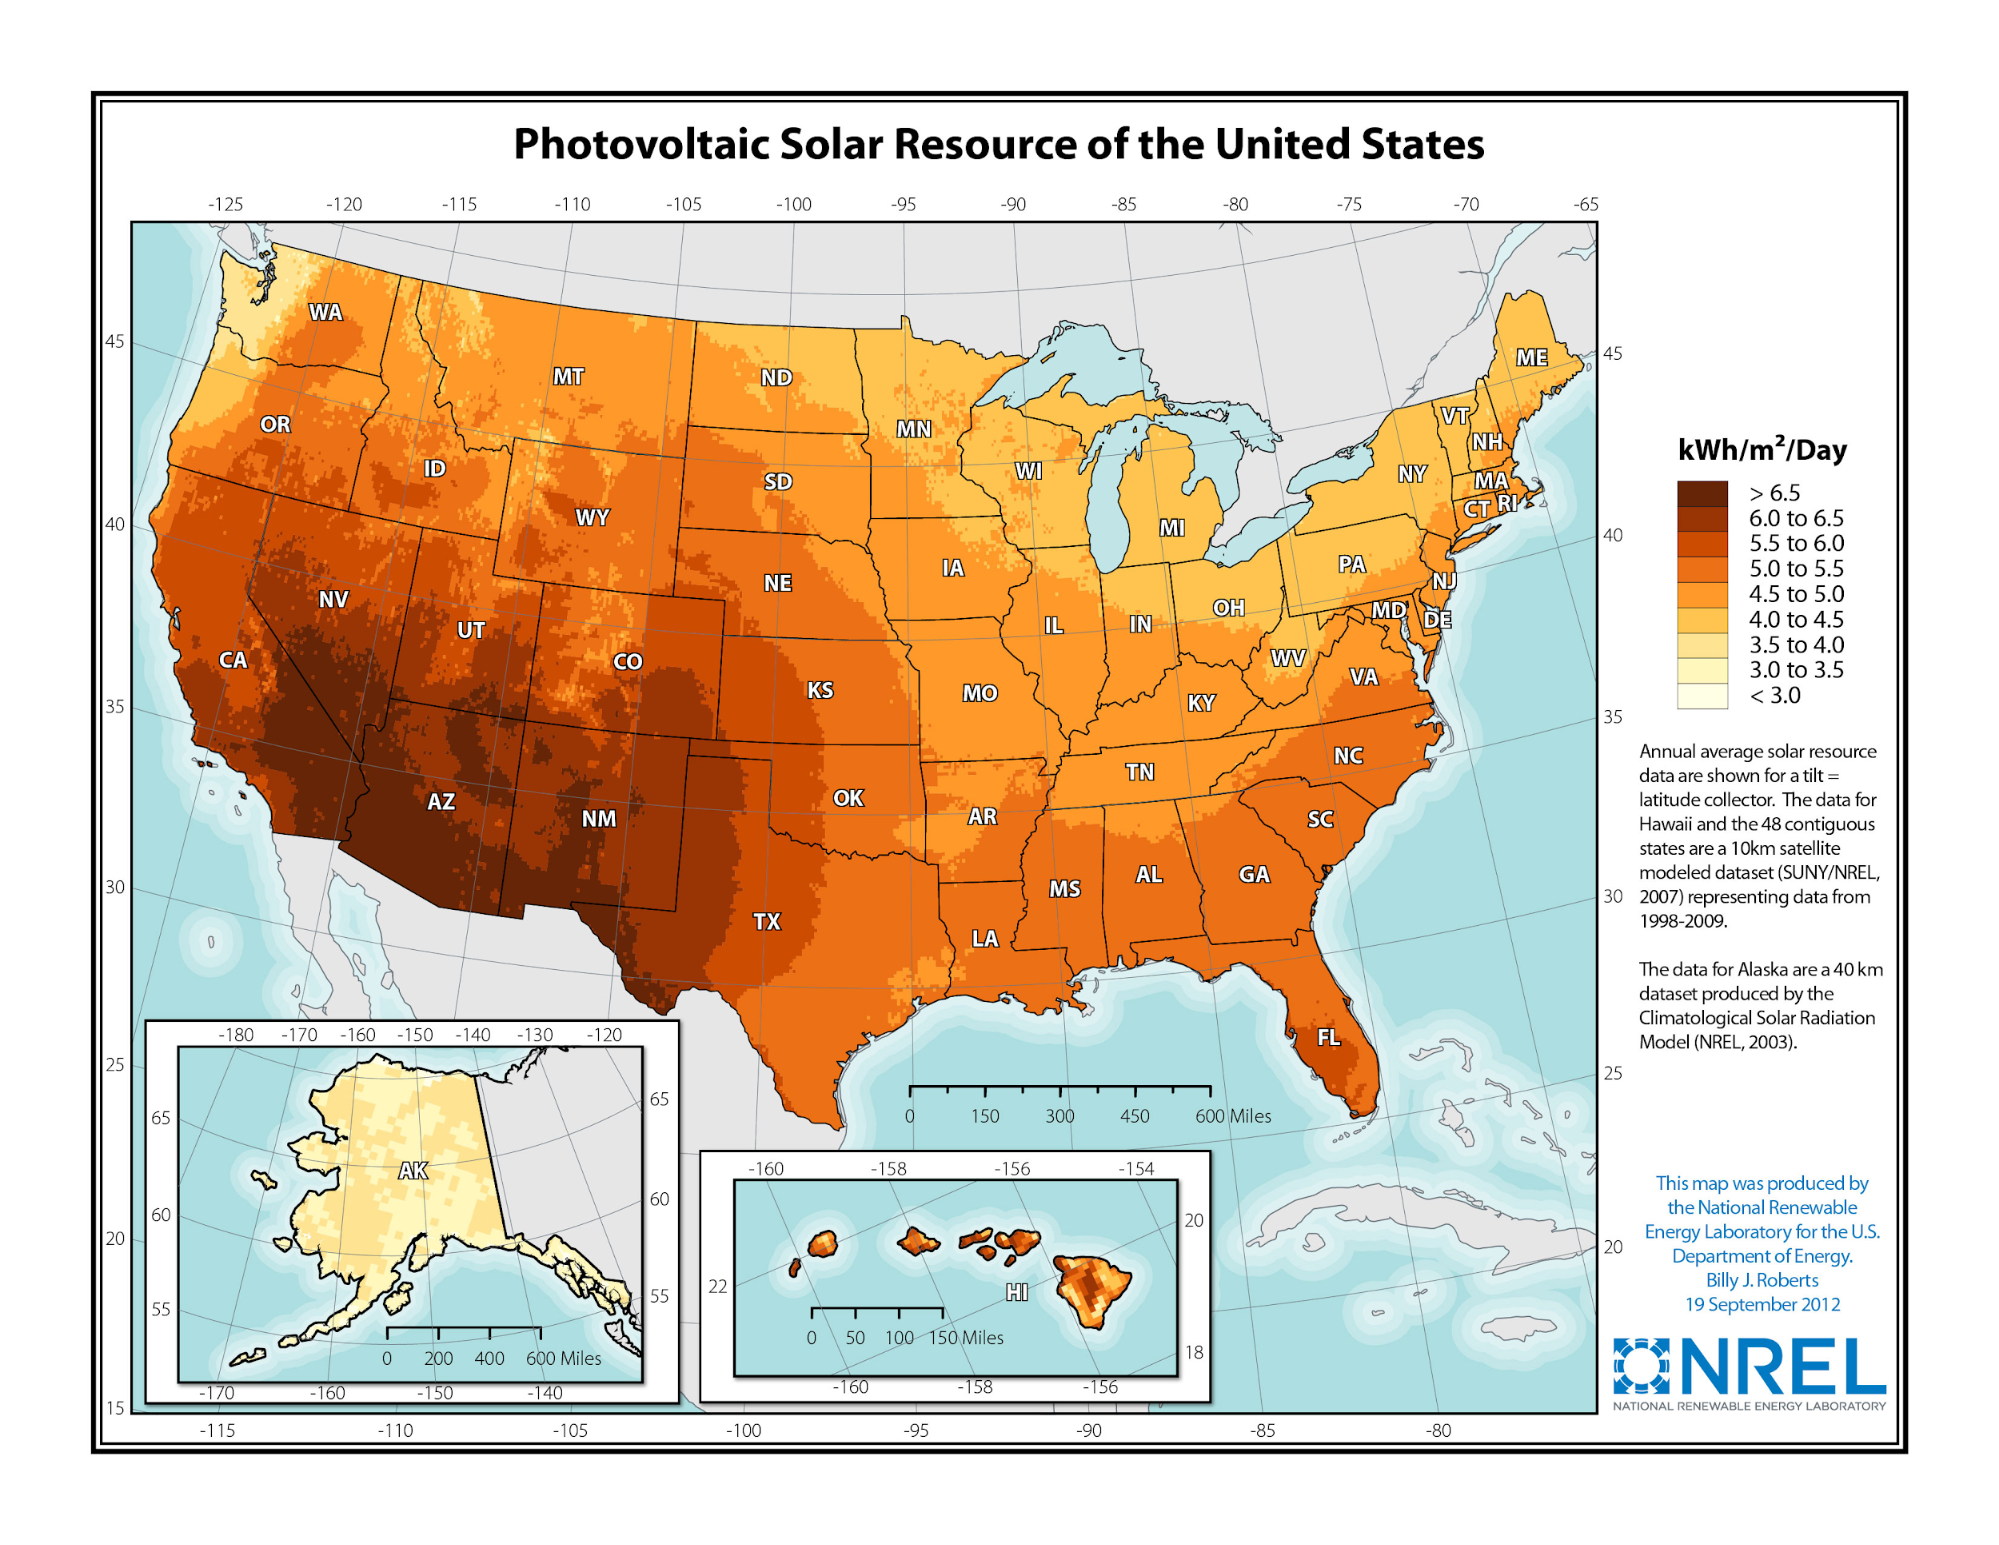
The heat map shows the most solar power potential in the Southwest corner of the United States, especially along the southern borders of Arizona, New Mexico, and California and extending up in to Nevada. The South and South Atlantic states, as well as Kansas, Nebraska, Wyoming, and some of Idaho and Oregon, still receive quite a bit of solar, and the Great Lakes region and very northwestern corner of the U.S. receive less. Alaska receives far less solar than anywhere else in the states, and Hawaii varies greatly, which is evident to be caused from the mountainous and forested landscape.